Customer Journey Mapping
PROJECT OVERVIEW
HomePoint Financial, a leader within the wholesale mortgage industry, wanted to improve the process and experience of external Brokers using their software. In order to coordinate pain points of the user experience along with the correlating actions, a series of interviews were held with those that were dubbed ‘power users’ - those that were in the top 10% of user activity. These findings were combined with deep analytic dives to provide the basis of the data.
A significant KPI was identified: how do you synthesize this data to provide a tool that allows the business a complete picture of the experience?
Approach & Research
The first step with such a complex subject matter was to collaborate with Product Owners, Business Analysts, Engineers and most importantly, end users. There was a vast quantity of data available but we wanted to simplify as much as possible.
Key questions needed to be asked:
What were the most important items to track?
What was the most confusing?
What do they wish could be clearer?
Had any previous attempts been made to visualize this data?
What worked and what didn’t?
Did any interaction with the data need to take place?
Strategy
Gathering the required information was the easy part, synthesizing the data into a format that was technically ingestible by the various lines of business was another. It needed to be easily understood, accurate and showcases the power of the research that was accomplished.
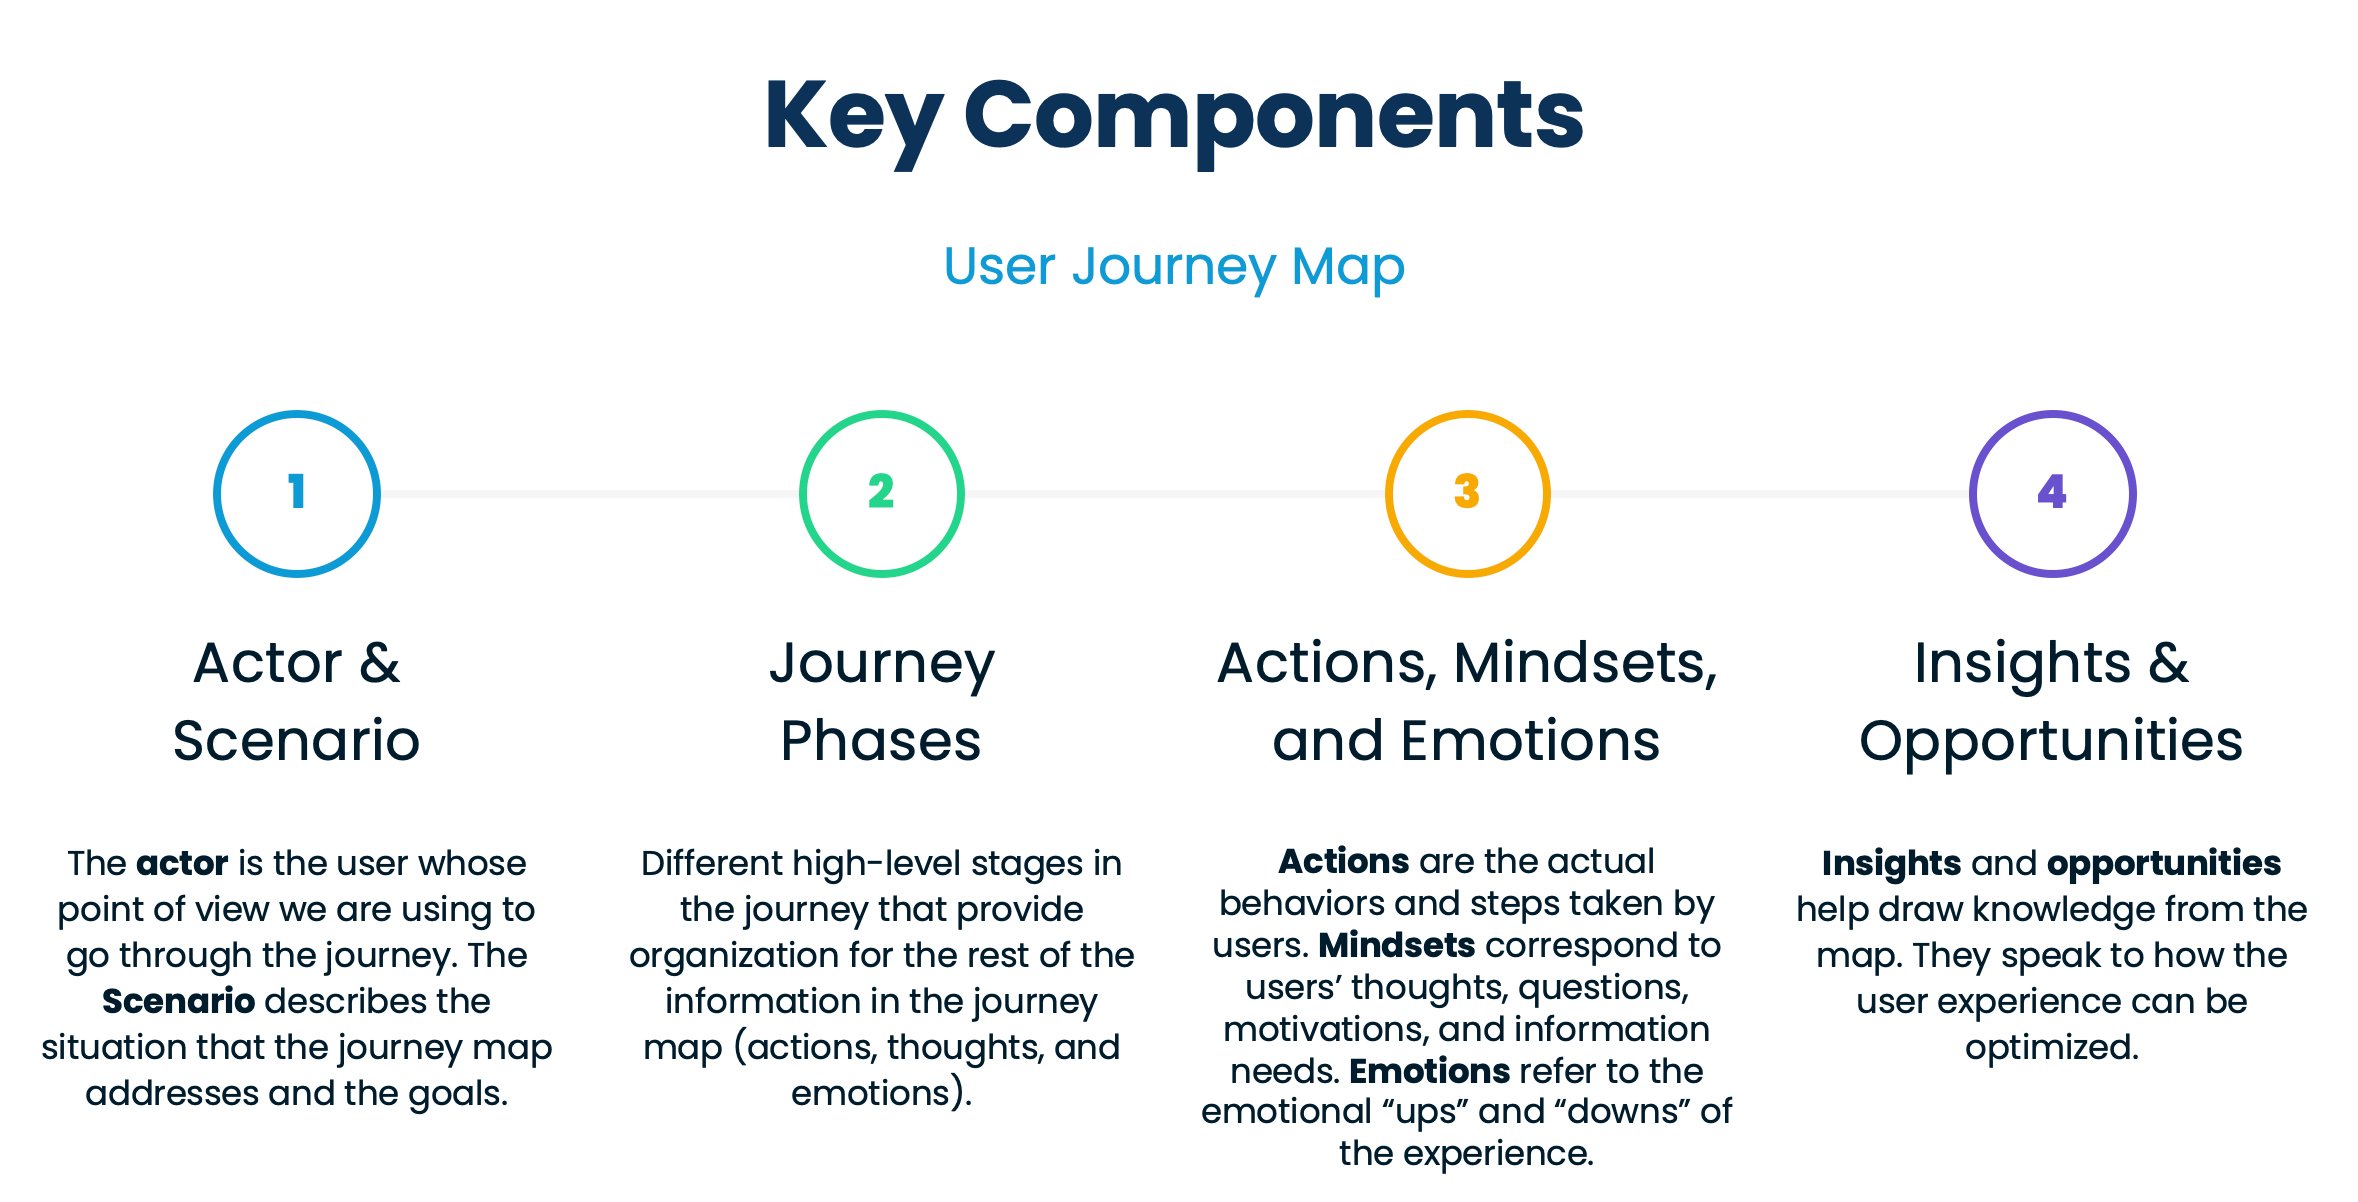
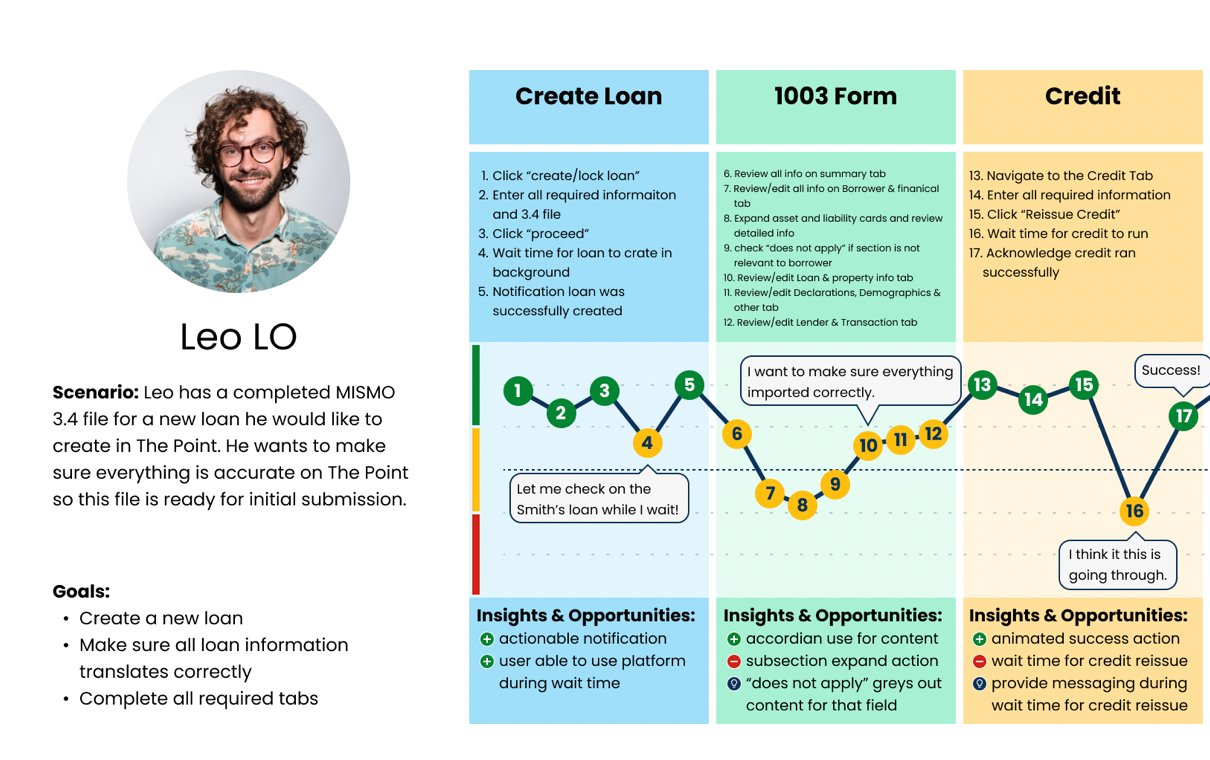
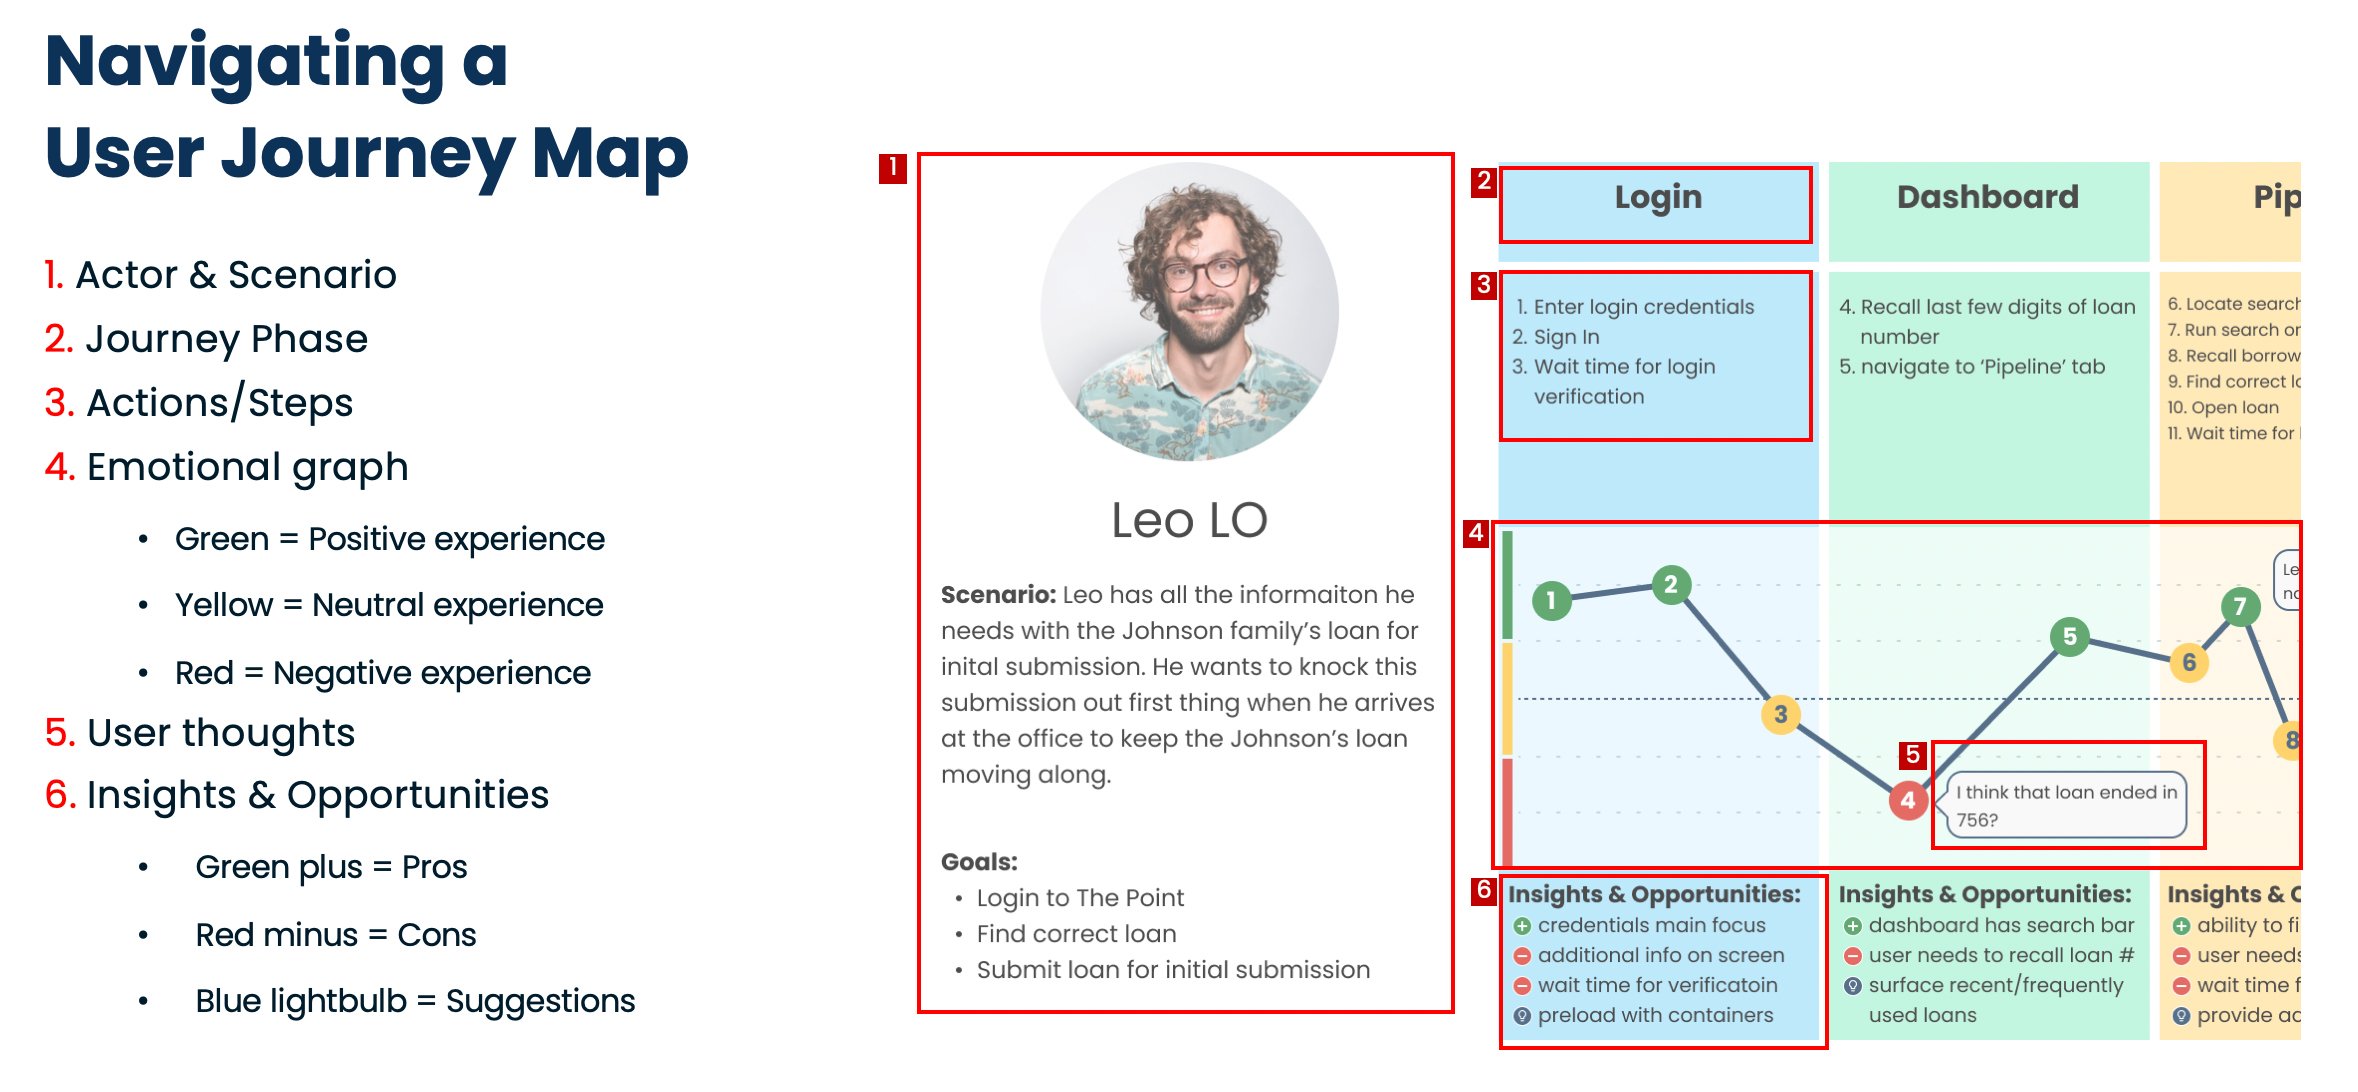
A User Journey Map was utilized on a task by task basis. Four key components were identified and utilized to create the map which was partnered with the top three tasks by overall user task completion. There also needed to be a way that the audience could see each of these components and how it corresponded with the emotions, thoughts and insights of the user. A brief navigation primer was created to guide the audience on how to interpret the map.
Process & Dissemination
Once the data and insights were gathered, the User Journey Map was created highlight each step of the task, the user’s thoughts and overall insights gathered from the process. This allowed the team to understand:
What was successful from not only an experience standpoint, but from a business one as well
Opportunities to improve the overall flow and time to completion rate
Where the team could focus and reallocate resources to better address the concerns of our user base

End Result
When deployed, the User Journey Map highlight several key elements of the existing experience and provided the team with a variety of information that not only improved the experience, but garnered cost savings moving forward. It also highlighted:
Consistency issues in not only content and verbiage, but also in patterns and expectations
3rd Party Vendor issues / wait times
Opportunities to improve the flow and dissemination of information for consumption by end users
What our brokers value and what provides significant stress