Keystroke Level Modeling
PROJECT OVERVIEW
Homepoint Financial Inc., was looking for a way to reduce costs and improve profits during a difficult period of time in the wholesale mortgage industry.
How could the company provide more value and generate revenue while simultaneously reducing the investment on accomplishing such tasks?
The answer: KeyStroke Level Modeling (KLM) audits.
The Goal
Reduce costs and improve revenue by streamlining the experience that our 9,000+ brokers used when generating wholesale mortgage loans without redesigning or reinventing the existing experience.
In an ideal state, the findings from the KLM studies could be scaled across the enterprise to provide an exponential cost savings result while also attracting new business.

Approach & Research
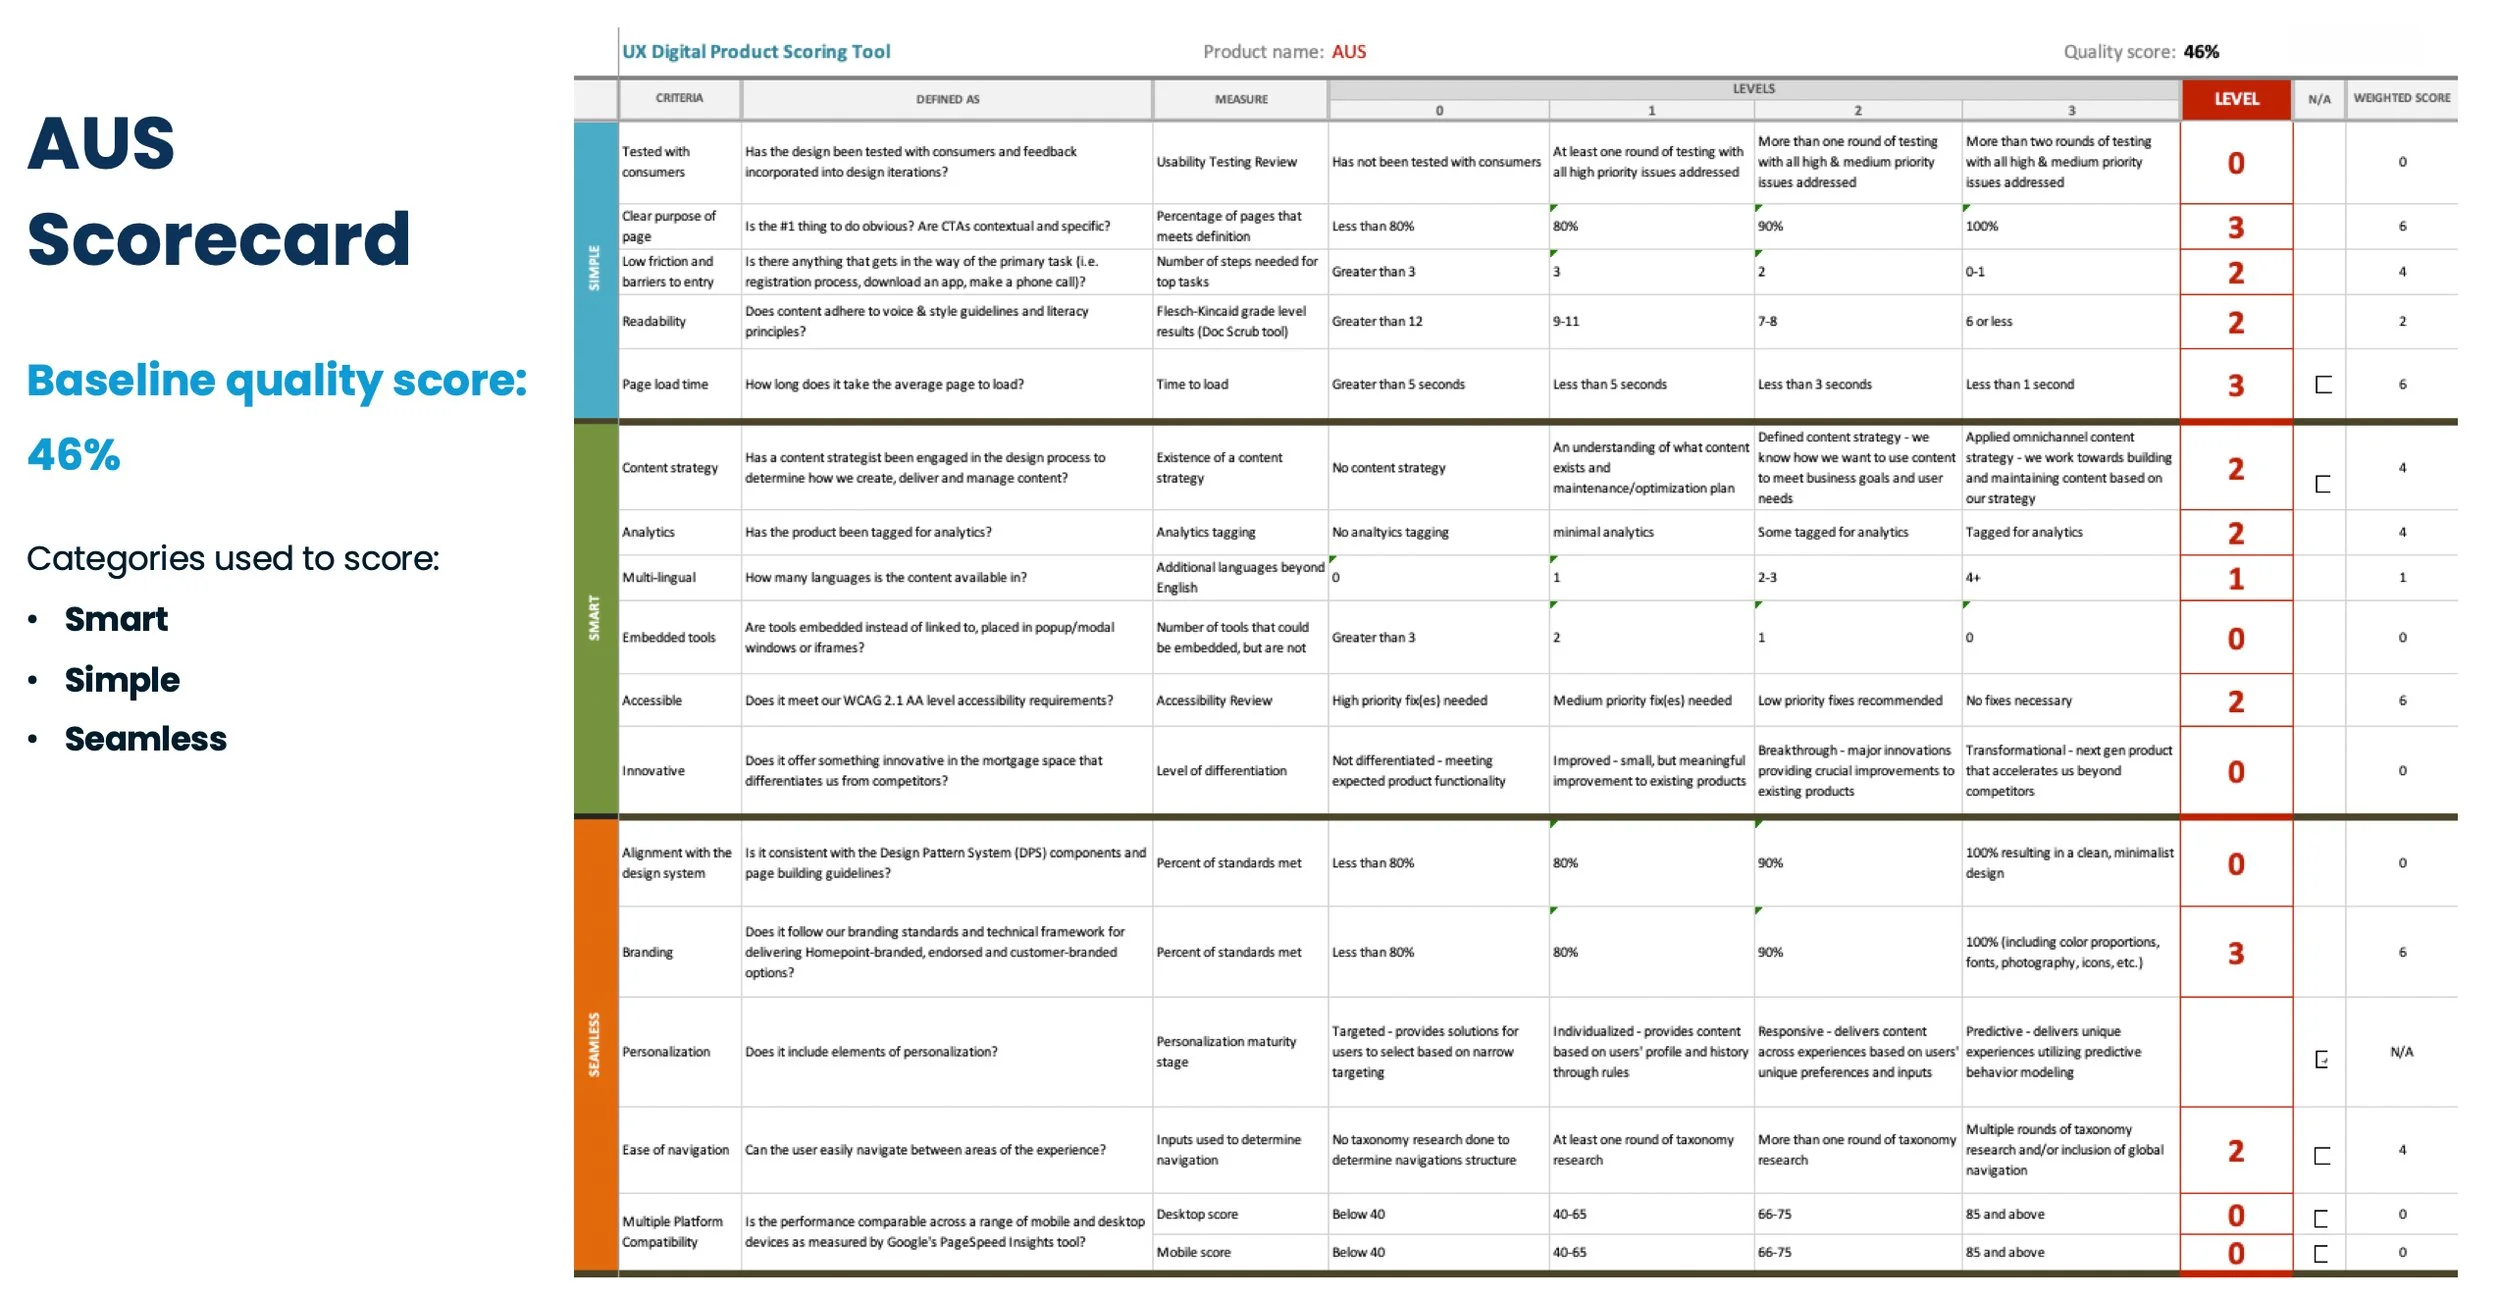
KLM is a powerful tool, but should not be used on its own. When combined with a UX Scorecard, it allows for the quantitative measurement of a qualitative experience. The first step would be to set up a baseline of the existing experience to gather the necessary data for a meaningful comparison.
What is a UX Scorecard?
A tool to help identify and score the quality of an experience in our product based on a set of criteria
Used to gain an understanding of how a user interacts with our product and to quickly spot opportunities for improvement
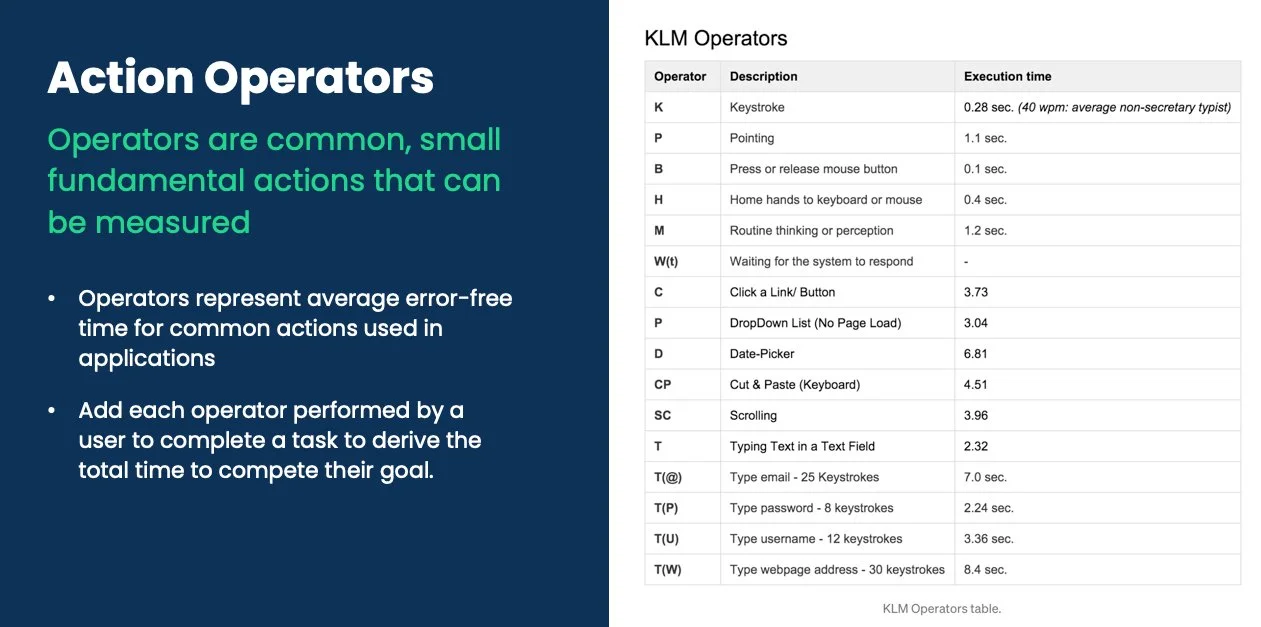
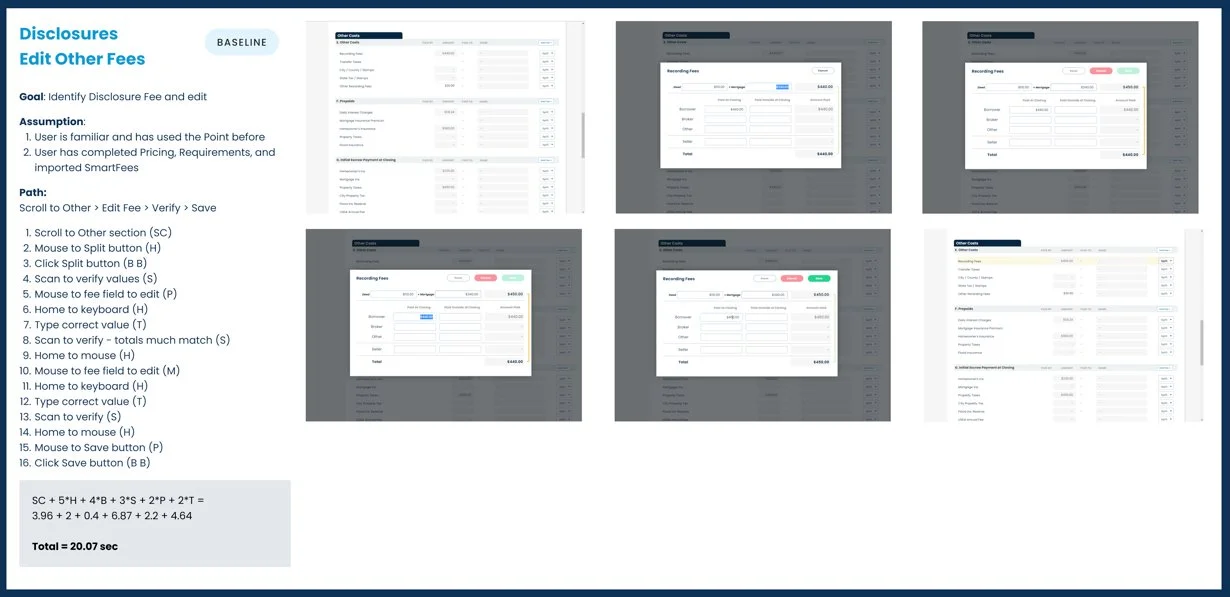
Strategy
KLM is a heuristic evaluation tool to predict how long it takes for an expert user to complete a goal. First, the top 3 tasks based on quantity - overall numbers are more impactful than qualitative experiences within this type of activity. To properly set a baseline in which to compare against, we used research derived calculations of the time each action, step or operator, takes for said user to complete a task. Finally, we mathematically aggregated these results to estimate an accurate total time to accomplish their goal.
In order to properly utilize KLM, several simple steps need to be identified and executed:
Define the goal of the user and describe it as a task
Make appropriate assumptions
Break the goal into measurable fundamental actions
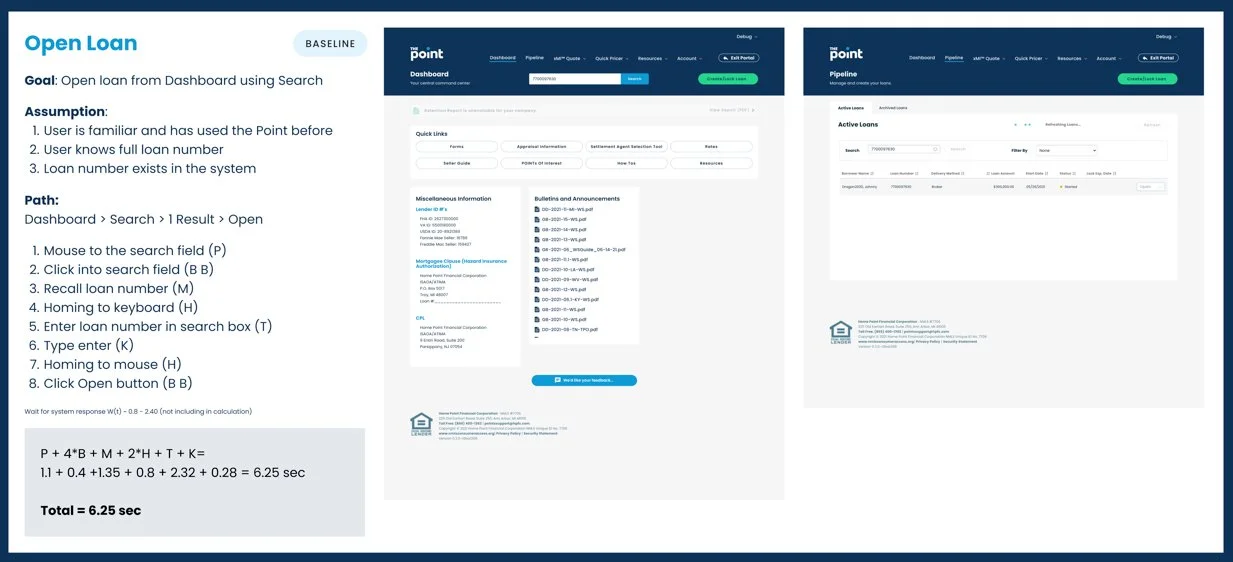
Process & Implementation
Each of the identified tasks were then given a baseline UX Scorecard score that were based upon three categories: Simple, Seamless, and Smart. Goals of each task were defined, along with overall assumptions. From here the action operators or steps of each task was identified along with the necessary workflow paths and tallied. A final KLM score of required steps and overall minimal time to complete the task was then used to summarize the existing experience.
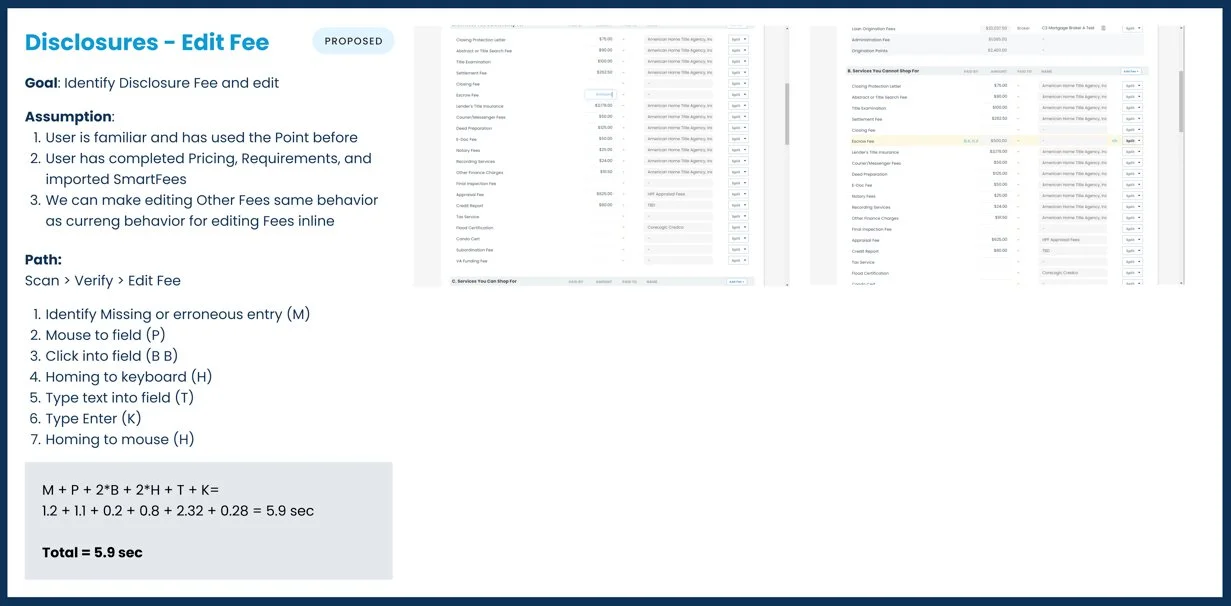
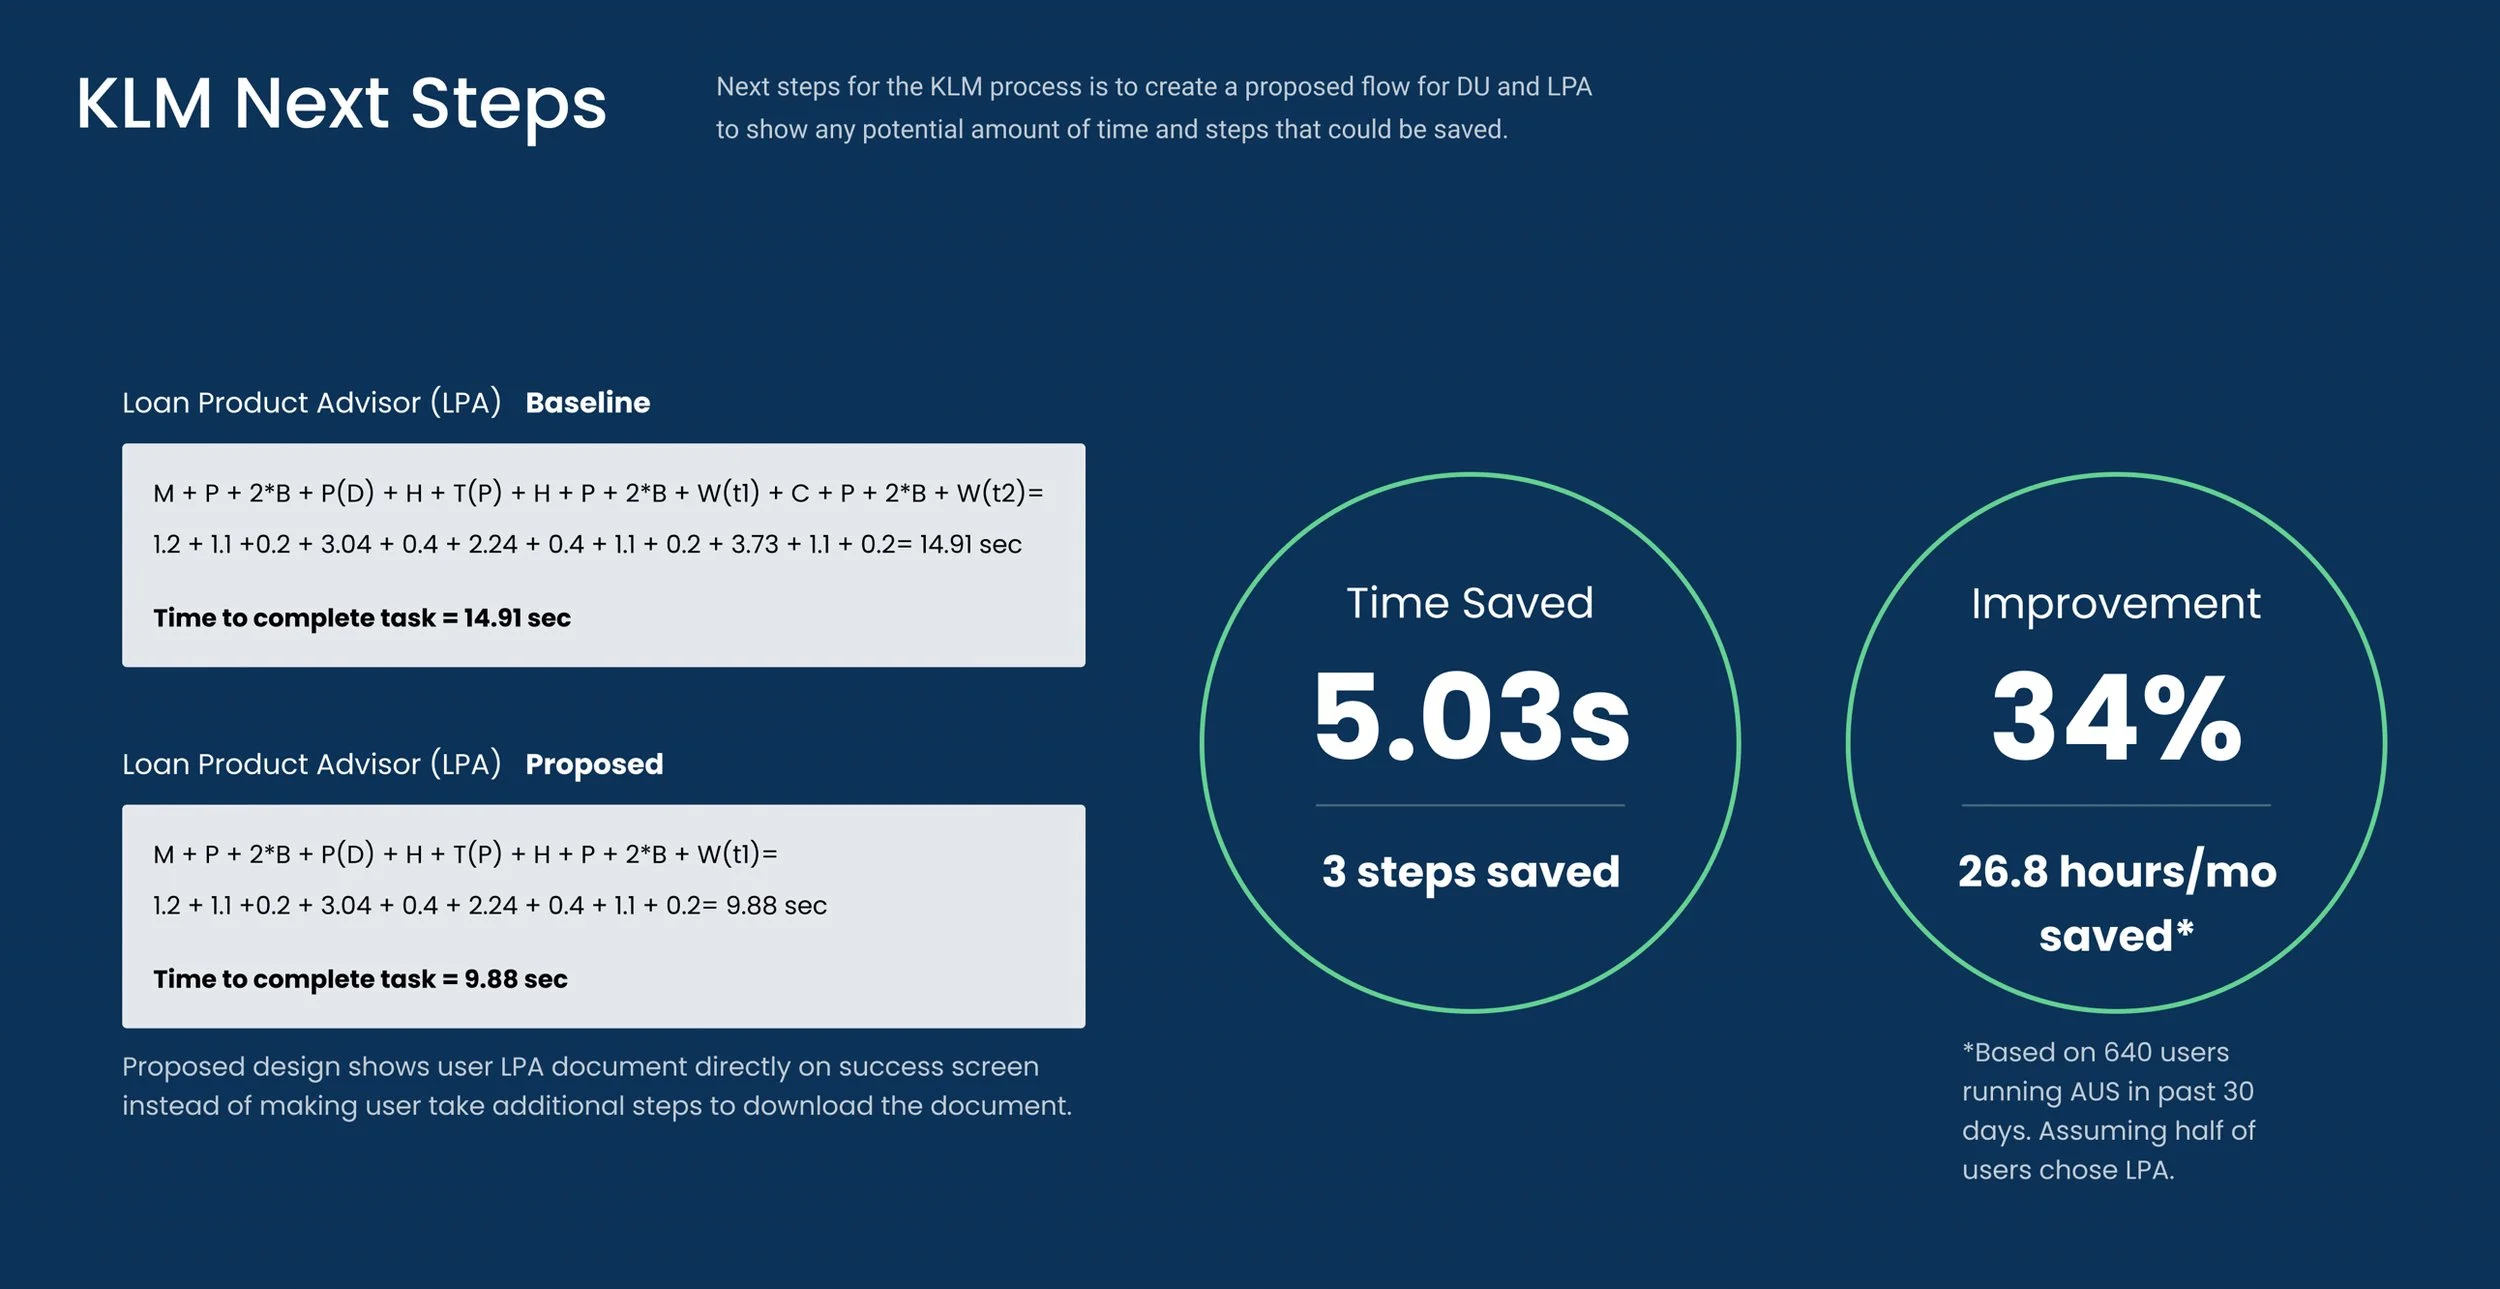
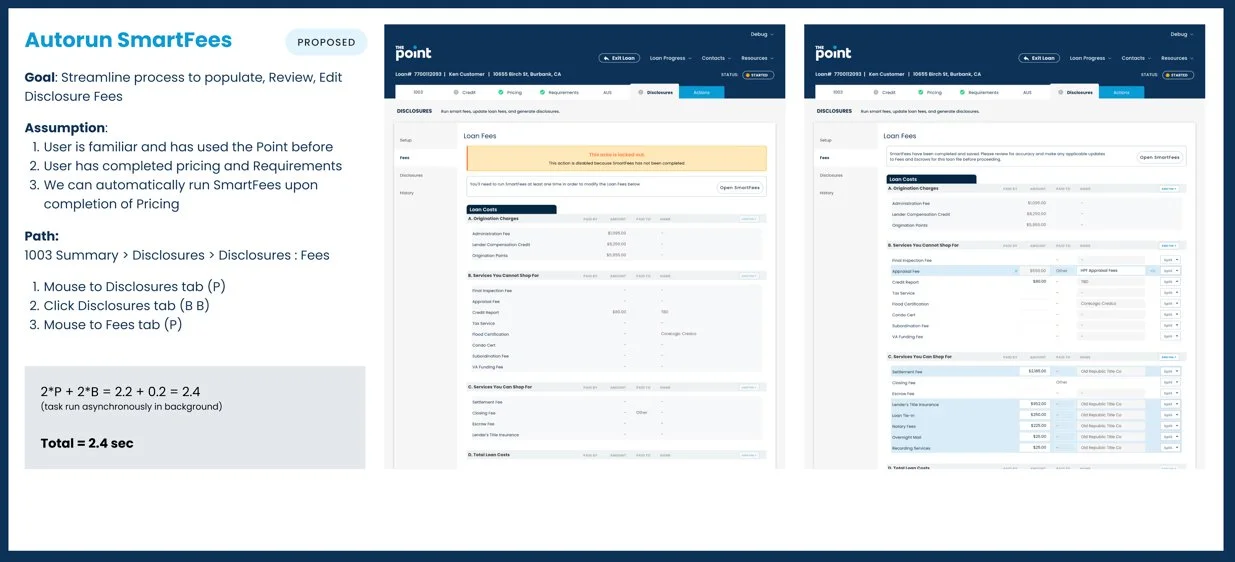
From here, bottle necks and areas of opportunity could be identified and appropriate resources could be allocated to address them. It also allowed for enough introspection into the process that pauses and issues created by 3rd party vendors could be pinpointed and appropriate leverage enacted to insure improvement. Finally, a proposed design could be created using the data discovered in the KLM process by improving the information architecture without having to spend significant effort on creating new components. A new UX Scorecard would then be run as well as KLM audits on the proposed design.
End Result
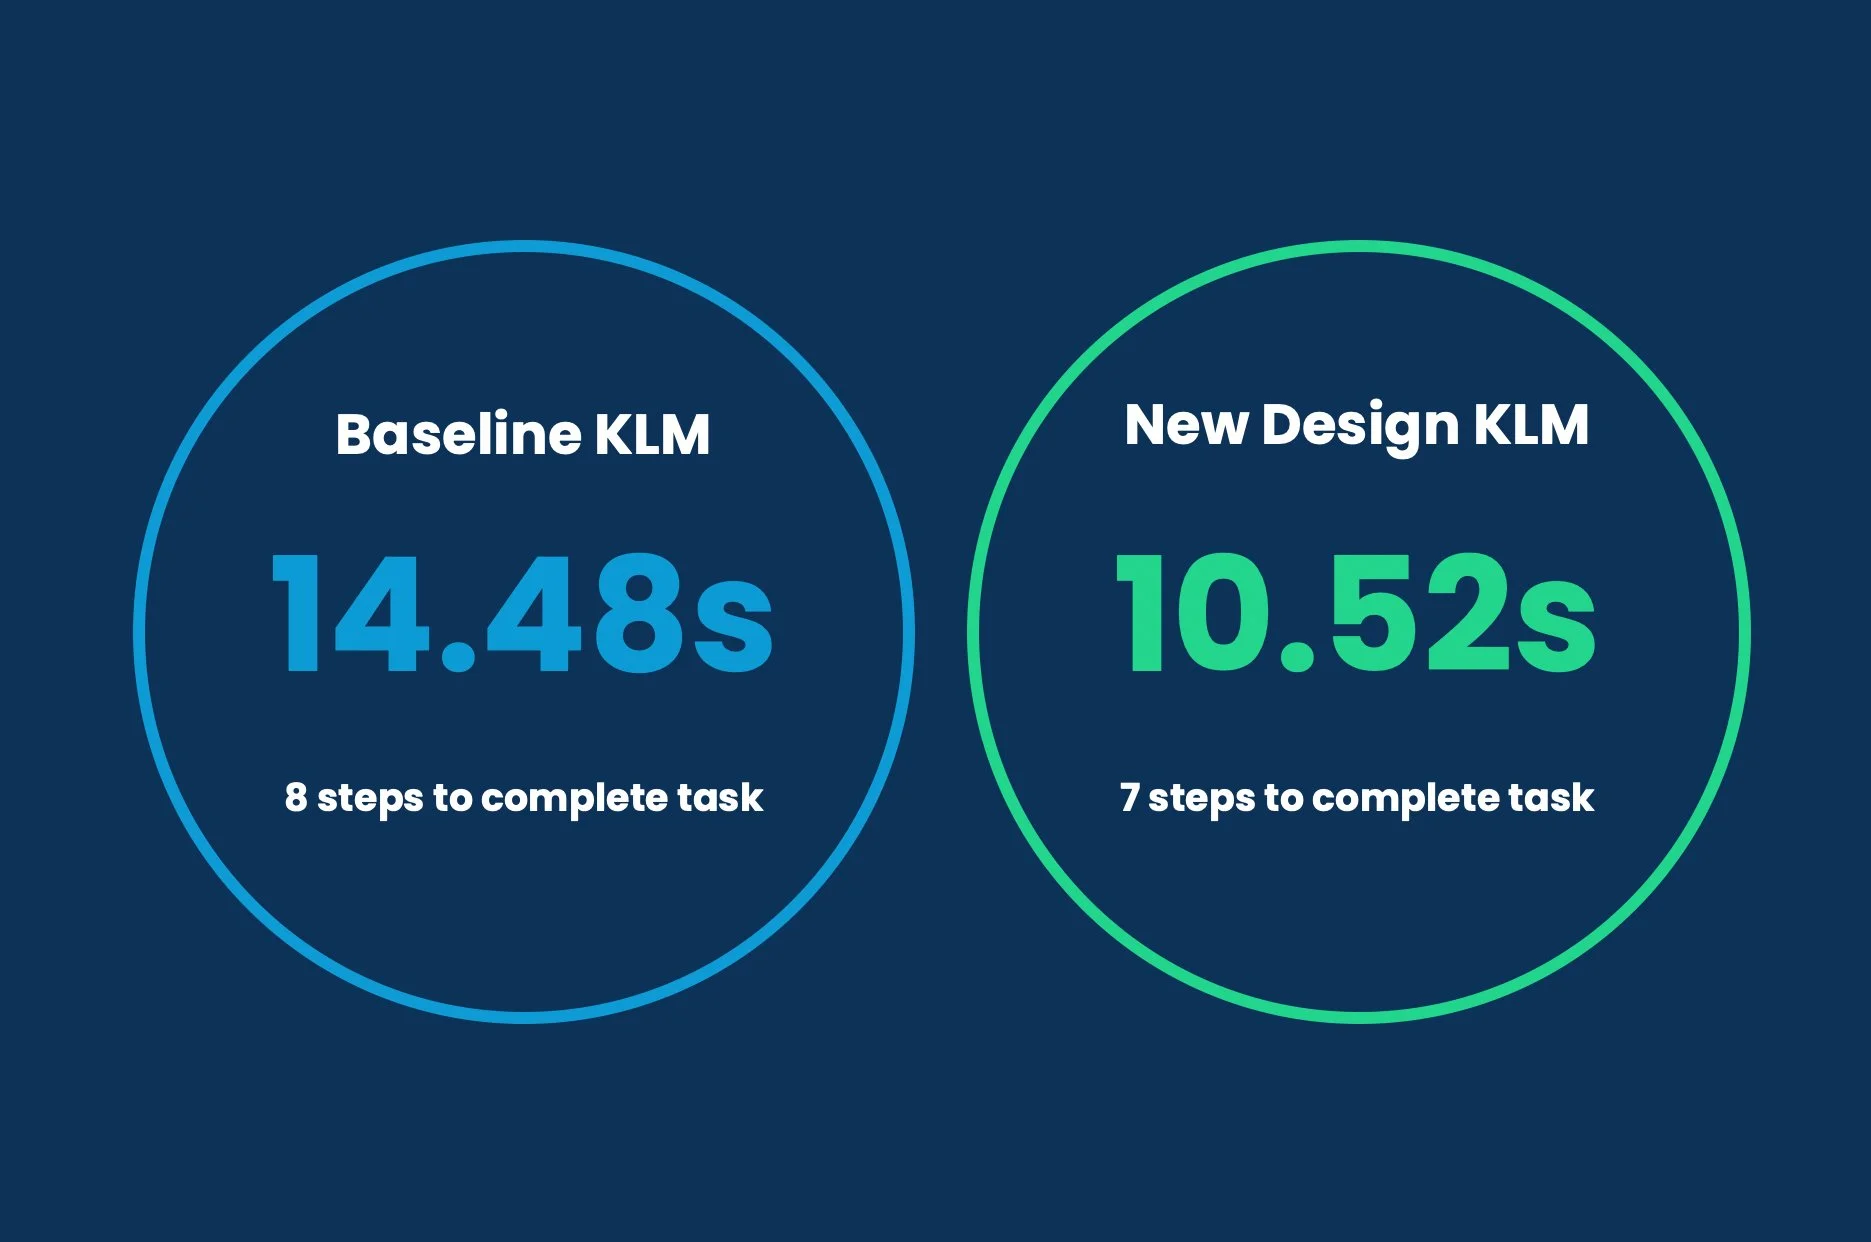
With KLM audits properly deployed and engineering following the direction of UX, Homepoint saw significant reduction in time to completion as well as savings of upwards of $1.5M/year on one task alone.
We found that every 4 seconds of time removed per task per product equalled approximately 287 hours of work per year. Time saved = money saved.
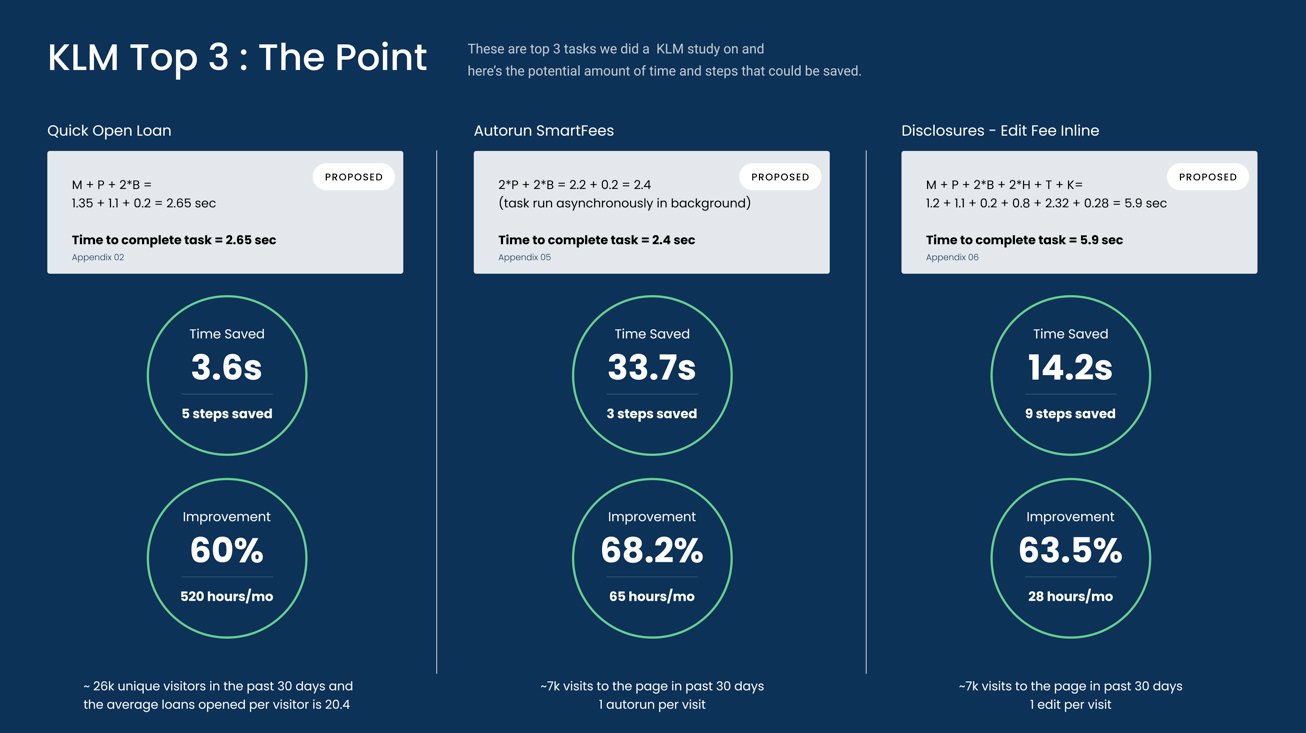
When scaled across the enterprise and portfolio of products, the numbers jumped significantly as you can see in the charts below.